








In this article
- What A, B and C actually mean
- How to calculate ABC inventory classes
- 1. Collect usage and unit cost
- 2. Calculate annual consumption value
- 3. Sort from highest to lowest value
- 4. Calculate each item’s share and the cumulative share
- 5. Assign classes with a stated boundary rule
- Worked example: a C item can be used thousands of times
- Turn the classes into different controls
- Add production criticality before changing stock policy
- Connect every material class to the schedule with SkyPlanner
- What better material visibility changed at Eskomatic
- Start with one material group and one real shortage
Home » Resources » ABC Inventory Analysis: Calculate Classes That Work
Estimated reading time: 10 minutes
ABC inventory analysis groups stock items by their annual consumption value: how much you use in a year multiplied by the cost per unit. A items account for the largest share of that value, B items the next share, and C items the remainder. The aim is to spend your inventory-control effort where it has the greatest financial effect.
For a manufacturer, there is an important second question: which missing item could stop an order? A low-cost bolt can belong in class C and still hold up an entire assembly. ABC tells you where the money goes; it does not tell you which jobs are safe to start.
Use the classification to set sensible purchasing and stock-control policies. Then connect material availability to the production schedule with SkyPlanner APS, so a cheap missing component receives attention when it threatens delivery, not only when its annual spend is high.
What A, B and C actually mean
In a consumption-value analysis, the classes describe financial concentration, not quality, profit margin or production priority.
- A items make up the first, largest share of annual consumption value. These deserve close attention to stock accuracy, purchasing commitments and excess inventory.
- B items make up the next share. Standard controls and regular review usually make more sense than managing each one as an exception.
- C items make up the remaining, smaller share of consumption value. The opportunity is often to simplify routine replenishment and administration without exposing production to avoidable shortages.
A common starting point is to put roughly 80% of consumption value in A, the next 15% in B and the remaining 5% in C. These are policy boundaries, not universal rules. Your actual distribution may be different.
The familiar 80/20 idea describes how value can be concentrated in a relatively small group of items. It does not require exactly 20% of your item codes to be A. Calculate the distribution first rather than forcing the item count to fit a predetermined pattern.
How to calculate ABC inventory classes
Start with one clearly defined population, such as the purchased materials and components used by a plant. Use a consistent twelve-month period and one cost basis. Do not mix raw-material consumption and the full value of finished products into one ranking without accounting for the overlap: that can count the same underlying material value twice.
1. Collect usage and unit cost
For each item code, record the quantity consumed during the period and its unit cost. Keep units aligned: a quantity recorded in pieces needs a cost per piece, not a cost per box. Use the same currency and a consistent valuation basis across the list.
Historical usage is a practical starting point, but check whether it represents the work ahead. A discontinued product, a new contract or a period when shortages suppressed consumption can make the past year misleading. If you use forecast annual consumption instead, label it clearly and use it consistently.
2. Calculate annual consumption value
Annual consumption value = annual quantity consumed × unit cost
This is a flow over a year, not today’s inventory balance. An item can have little stock on the shelf and still account for a large annual spend because you replenish it frequently.
It is also not the selling price or sales revenue. For this manufacturing materials analysis, you are ranking the cost of what production consumes.
3. Sort from highest to lowest value
Add the annual consumption values to obtain the total, then sort the item rows in descending order. Do not rank by unit price alone. An inexpensive material used in very large quantities may outrank a costly part used only occasionally.
4. Calculate each item’s share and the cumulative share
Item value share = item annual consumption value ÷ total annual consumption value × 100%
The cumulative share is the running total as you move down the sorted list. That running total shows where to draw the class boundaries.
5. Assign classes with a stated boundary rule
For an 80/15/5 policy, fill A until cumulative value reaches or passes 80%, then fill B until it reaches or passes 95%. The remaining items are C. Keep a whole item code in one class.
This convention includes the item that crosses a boundary in the class being filled. If A moves from 79% to 83% with the next item, that item remains A and B starts on the following row. Another consistent convention is possible; record yours so the next analyst can reproduce the result. Handle equal-value items consistently too, rather than allowing a changed sort order to create unexplained class movements.
Worked example: a C item can be used thousands of times
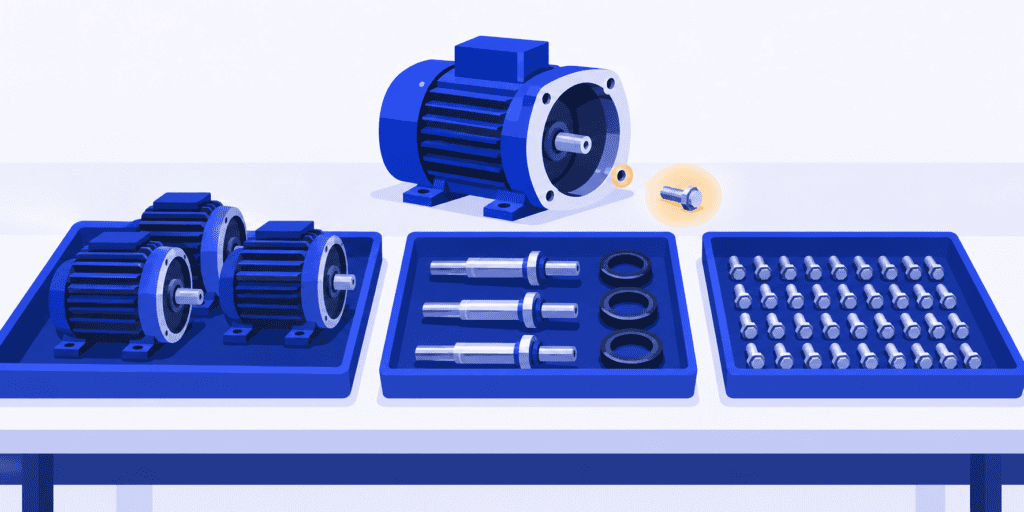
Imagine a manufacturer analysing six purchased materials. The figures below are illustrative, not customer results. Annual consumption value totals $100,000. Rows are sorted by that value; the two equal-value rows retain their original item-list order.
| Material | Annual usage | Cost per unit | Annual consumption value | Share of total | Cumulative share | Class |
|---|---|---|---|---|---|---|
| Motors | 200 | $300.00 | $60,000 | 60% | 60% | A |
| Housings | 400 | $50.00 | $20,000 | 20% | 80% | A |
| Shafts | 600 | $20.00 | $12,000 | 12% | 92% | B |
| Seals | 6,000 | $0.50 | $3,000 | 3% | 95% | B |
| Bolts | 30,000 | $0.10 | $3,000 | 3% | 98% | C |
| Labels | 100,000 | $0.02 | $2,000 | 2% | 100% | C |
For the housings, the calculation is 400 × $50 = $20,000. Dividing by $100,000 gives a 20% share. Added to the motors’ 60%, that brings the cumulative share to 80% and completes class A.
The shafts and seals add 15%, completing B at 95%. Bolts and labels account for the final 5%, so they are C under this policy.
Notice what the calculation does not say. The manufacturer consumes 30,000 bolts, yet they remain C because their annual cost is relatively small. C does not mean rarely used, obsolete or safe to run out of. Nor does A mean that the motors should automatically receive priority in the machine queue.
Turn the classes into different controls
The classification earns its keep when it changes how you work. Give each class a control policy, an owner and a review routine rather than simply adding a letter to the item master.
| Class | Practical control focus | What to avoid |
|---|---|---|
| A | Review purchasing commitments and excess stock closely; use frequent stock-accuracy checks where errors create significant financial exposure; watch changes in demand and cost. | Buying extra stock simply because an item is A, or reducing it so aggressively that supply becomes unreliable. |
| B | Use a standard replenishment policy and regular exception review; investigate items whose value or supply behaviour is changing. | Letting the middle group become an unmanaged gap between strict A controls and simple C routines. |
| C | Reduce transaction effort with suitable pack sizes, two-bin replenishment or supplier arrangements; keep enough protection for the actual supply risk. | Treating small annual spend as permission to ignore shortages, shelf life or production dependence. |
The right counting frequency and purchasing review interval depend on your operation. A stable item with reliable records needs different attention from one with repeated stock discrepancies, even within the same class.
Likewise, a larger C-item order can be economical if it saves repeated purchasing and handling work, but not if the material expires or becomes obsolete. ABC helps allocate attention; it does not calculate the best order quantity or the safety stock you need.
Keep the safety-stock decision separate. Set the buffer from uncertainty, replenishment time and the consequence of a shortage, rather than applying one stock percentage to every A, B or C item.
Add production criticality before changing stock policy
Before reducing control on C items, ask what happens when each one is unavailable. Check whether there is an approved substitute, how quickly replacement supply can arrive, and which customer orders depend on it.
Keep criticality visible alongside the ABC class. A C-class bolt with no approved substitute can deserve urgent shortage attention even though it does not deserve the same purchasing scrutiny as an A-class motor. You do not need to relabel it A to recognise that risk.
Demand variability is another separate dimension. Two items with the same annual consumption value may behave very differently: one is used steadily, while the other is needed in occasional large withdrawals. Check that pattern before giving them the same replenishment routine.
Imagine the motors and housings for an assembly order are available, but the required bolt is missing. The order looks well covered in financial terms. Operationally, assembly cannot finish without that component. Starting work early may only create unfinished assemblies, extra handling and another queue to monitor.
The useful next question is not “Which class is the bolt?” It is “When can this order actually run, and what can the team do in the meantime?”
Connect every material class to the schedule with SkyPlanner
SkyPlanner APS brings material availability into the same scheduling calculation as workstations, shifts, operation dependencies and priorities. With material-aware scheduling enabled, Arcturus considers available materials and expected incoming deliveries when calculating job start times. A job is not scheduled to start before its required materials are available under those rules.
That makes the missing bolt a scheduling constraint, not just a low-value line in an inventory report. You can review the planned operations and completion in the Gantt view instead of comparing stock balances with separate machine queues by hand. The benefit is fewer planned starts that cannot be supported by materials and earlier visibility of delivery problems.
Purchase-order delivery dates represent expected availability. Confirming a purchase order as delivered updates stock; an expected receipt is not the same as material already on hand. If the supplier changes the expected date, update the information and recalculate the schedule to see the effect on the work.
You still decide the priorities. Arcturus calculates the sequence within the rules and capacity you define, so you can assess the affected commitments rather than moving every operation yourself. This is why SkyPlanner is a useful complement to ABC control: financial attention stays focused, while production readiness accounts for the components that each job actually needs.
SkyPlanner integrates with any ERP or MES through its open REST API. You can keep the system that holds your purchasing and item data while connecting it to a production schedule that reflects material availability.
What better material visibility changed at Eskomatic
Contract machining company Eskomatic previously relied on largely manual work queues in an older ERP and production-control environment. Building an overall picture took effort, and limited visibility of material availability meant a shortage could surface too close to a job’s planned start.
With SkyPlanner connected to its existing ERP, the team gained a visual Gantt work queue, automatic load scheduling and clearer visibility of material shortages. In its SkyPlanner customer account, Eskomatic reports fewer production stoppages caused by missing materials and more accurate delivery-date setting.
That experience illustrates the operational improvement beyond a classification exercise: the planner can see the material problem in the context of the work it affects. It is a reason to connect stock control to scheduling, rather than expecting an ABC label to protect delivery on its own.
Start with one material group and one real shortage
Choose a clearly defined group of materials, calculate consumption values and agree the boundaries. Apply the resulting control policies, then review the C items for production criticality before simplifying their replenishment. Revisit the classification when demand, costs or the product mix change, and give new and zero-consumption items an explicit review rather than assuming historical usage tells the whole story.
Use ABC to put financial attention in the right place. Use SkyPlanner to turn material readiness and capacity into a plan the shop can follow.
Book a SkyPlanner demo with a recent assembly order that was delayed by a missing component. Bring the material requirements, expected receipt and production route, and see how the shortage changes the planned start and completion alongside your other work. If you prefer to explore first, try SkyPlanner with demo data.
Jussi Mäntylä
Production Planning Specialist, SkyPlanner


