








In this article
- What belongs in COPQ, and what belongs in cost of quality?
- Build the calculation around traceable failures
- 1. State the area, period and costing basis
- 2. Follow each failure into its consequences
- 3. Give every cost one place in the total
- A worked cost of poor quality example
- Expressing COPQ as a percentage of sales
- Separate cost consumed, cash saved and capacity recovered
- Choose the first loss to fix, not just the biggest total
- Keep quality-generated work visible in SkyPlanner
- Bring one quality failure to a SkyPlanner demo
Home » Resources » Cost of Poor Quality: Calculate It and Cut the Loss
Estimated reading time: 11 minutes
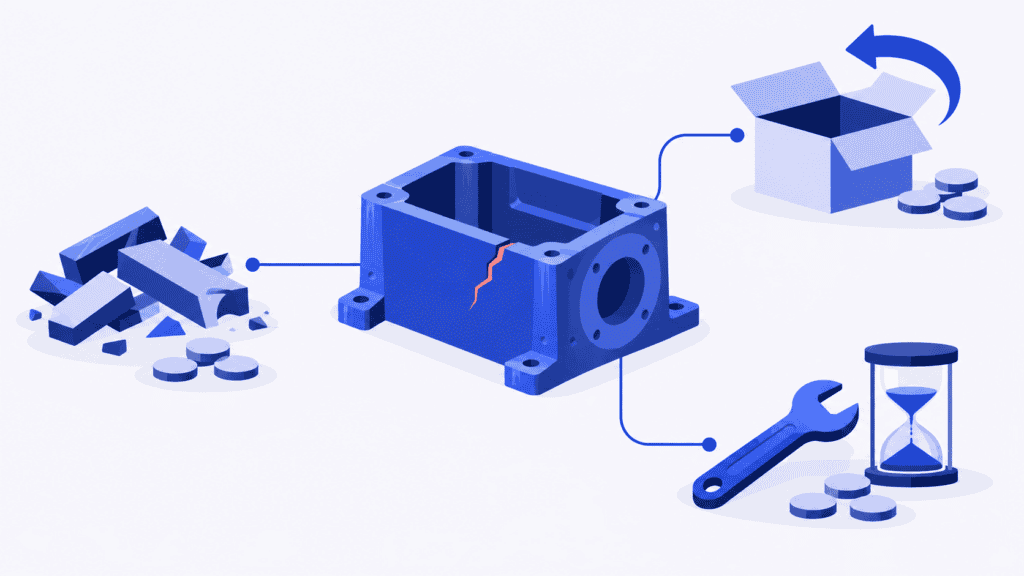
Cost of poor quality (COPQ) is the cost of internal and external quality failures: the resources lost and the extra work required because products or services did not meet requirements. In manufacturing, that includes more than the material in the scrap bin. Rework, failure-related sorting, customer returns and warranty recovery can consume money and production time long after the original defect.
The basic formula is:
Cost of poor quality = Internal failure costs + External failure costs
A reject percentage tells you how often production went wrong. COPQ helps you decide where that failure hurts most and which improvement deserves attention first. The useful result is not merely a larger loss figure: it is a clear connection between a quality problem, its cost and the action that will change it.
SkyPlanner helps make that connection operational. Faulty-unit material records and production time logs reveal the resources consumed; its shared production schedule helps you fit approved recovery work around the customer orders already promised.
What belongs in COPQ, and what belongs in cost of quality?
Use a failure-cost boundary for your COPQ calculation. This follows ASQ’s distinction between the costs of poor quality and the broader cost of quality (COQ).
Internal failure costs arise from defects found before the customer receives the product. Think of rejected material, value already added to scrapped parts, corrective processing, repeat testing after failure and investigation of a failed batch.
External failure costs arise from defects found after the customer receives the product. These can include return transport, warranty repairs, replacement products, complaint handling and field service. The invoice may be in customer service rather than production, but the failure still caused it.
Prevention and routine appraisal belong in the wider COQ picture. Training, process planning, planned inspection and quality audits help prevent or detect problems; they are not automatically evidence that a failure occurred.
The distinction depends on why work was necessary. A normal final inspection is appraisal. An additional inspection of stock because a defective batch escaped is failure-related containment. Keep the purpose clear instead of classifying every inspection hour the same way.
For this model:
Cost of quality = Prevention costs + Appraisal costs + COPQ
Keeping those categories separate improves decisions. A better first-off check may increase appraisal effort while preventing much more expensive scrap. A training programme may increase prevention spending while reducing rework. The aim is better overall economics, not the smallest possible quality-department budget.
Build the calculation around traceable failures
Start with one production area or product family and one reporting period. A useful first calculation can be narrower than the whole factory, provided you name its boundary. Bring quality, production and finance together: quality identifies what failed, production explains the recovery effort, and finance checks the values and overlaps.
1. State the area, period and costing basis
A practical definition might be: “Monthly internal and external failure costs for the machined-components business, including consumed material and work valued at agreed resource rates, net of recoveries.”
Decide when costs enter the report. A monthly incurred-cost view can include warranty work on products shipped earlier. That is useful for managing the current burden, but it is not the lifetime failure cost of this month’s production. If you need the latter, follow a defined production group through its later claims instead.
Use consistent material values and labor and machine rates. An allocated resource cost is useful for showing what poor quality consumed, even when the underlying wage or equipment payment would have been made anyway. Keep that distinction for the later savings decision.
2. Follow each failure into its consequences
For each incident or reconciled batch, record the product or order, failed requirement, discovery point and disposition: scrap, rework, return or another approved response. Then collect the associated quantities, work time, additional materials, outside services and customer-recovery expenses.
Look beyond the original operation. A bad batch may require stores to isolate stock, inspectors to sort it, operators to correct it and customer service to arrange a return. Connecting those activities to the same incident makes the cost visible without blaming whichever department happens to book the expense.
Use production logs, material movements, nonconformance records, invoices and warranty records together. Mark estimated time or costs as estimates, and keep unresolved items visible. You can act on a well-supported partial calculation while improving the missing data.
3. Give every cost one place in the total
A scrap write-off may already include material, labor and applied overhead. If you use that amount, do not add its material and processing costs again. Similarly, a warranty settlement may already cover transport and repair that appear elsewhere in the records.
Check hourly rates before combining them. A machine rate that includes the operator cannot be added to the same operator’s full labor cost without adjustment. Person-hours and machine-hours can overlap in time while representing different resources, but their cost components must not overlap.
Also distinguish the failed output from its replacement. You can value the failed unit as the loss and treat one successful replacement as the normal cost of fulfilling the order. Do not then add the entire replacement cost as another loss. Capture genuinely additional recovery expenses, such as another setup or expedited transport, on a clearly stated basis.
A worked cost of poor quality example
Imagine a manufacturer reviewing one month’s failures in its machined-components business. The following figures are illustrative, in US dollars. It uses agreed resource rates, records each cost once and deducts documented recoveries.
| Failure cost | Calculation | Monthly cost |
|---|---|---|
| Internal scrap, net of recovery | 80 rejected parts × ($18 material + $12 conversion already incurred) − $160 scrap recovery | $2,240 |
| Internal rework labor | 120 parts × 0.25 person-hours × $30 per person-hour | $900 |
| Internal rework machine resources | 20 machine-hours × $20 per hour, excluding the labor counted above | $400 |
| Additional rework material | Material issued specifically for those corrections | $240 |
| Additional sorting after an internal failure | 12 person-hours × $30 per person-hour | $360 |
| External recovery | $300 return freight + 10 service person-hours × $40 + $900 purchased warranty replacements − $200 supplier credit | $1,400 |
The purchased replacements in the external-recovery row relate to a separate customer claim, not the 80 internally scrapped parts. No second write-off or all-inclusive warranty settlement for that claim is included elsewhere in the table.
Internal failure costs = $2,240 + $900 + $400 + $240 + $360 = $4,140
External failure costs = $1,400
Monthly COPQ = $4,140 + $1,400 = $5,540
This is a management resource-cost total for documented failures, not a promise that eliminating those failures would immediately remove $5,540 from next month’s payments. It excludes normal prevention and appraisal, unrecorded losses and speculative lost sales. Name those limits alongside the number so the result remains useful when the data improves.
Expressing COPQ as a percentage of sales
To compare the burden over time, you can calculate:
COPQ as a percentage of sales = COPQ ÷ Sales revenue for the stated scope and period × 100
If the same business area’s monthly sales are $200,000:
$5,540 ÷ $200,000 × 100 = 2.77%
That is a cost-to-sales ratio, not a defect rate. It also does not mean 2.77% of this month’s shipped products failed: the external costs may relate to earlier shipments. Read the dollar total and the underlying failure categories alongside the percentage. A stronger sales month can lower the ratio without removing a single recurring problem.
Separate cost consumed, cash saved and capacity recovered
The example’s rework consumed $1,540: $900 of labor, $400 of machine resources and $240 of material. It also used 30 person-hours and 20 machine-hours. Those are different views of the same work, not three extra costs to add to the total.
If an improvement removes that rework, the business gains the opportunity to use those hours differently. Whether it also saves cash depends on what changes. Avoided overtime, reduced material purchases and fewer outside repairs can reduce expenditure. Reassigning people within their existing paid shift creates useful capacity without necessarily reducing payroll.
The location of the recovered time matters too. Twenty hours on the machine holding up customer orders can be more valuable than twenty hours on a resource with no work waiting. If you estimate the extra contribution that recovered capacity could earn, show the demand, usable time and incremental costs behind the estimate. Keep it separate from the historical COPQ total; do not count lost sales revenue as though it were the same thing as lost profit.
This distinction makes the business case stronger. You can explain both the resources poor quality consumed and the specific financial or delivery benefit the proposed improvement can achieve.
Choose the first loss to fix, not just the biggest total
Group the costs by a useful problem definition: product family and failed requirement, for example, rather than only “scrap” and “rework.” Rank the recurring problems by cost to create a cost-based Pareto view. Then check what the ranking means for customers and production.
Urgent safety, conformity or customer risks need containment regardless of their position in a cost ranking. For improvement work, look for a significant recurring loss with evidence the team can investigate and an action it can own.
In the example, scrap is the largest recorded category at $2,240. But suppose the $1,540 rework problem recurs on the machine constraining an important delivery. That can make rework the better first investigation, even though its recorded cost is lower. The timing of those 20 machine-hours matters to the decision.
Before committing to a project, answer four questions:
- Is the loss recurring? Distinguish a repeated failure mode from one exceptional incident; check comparable periods and product mix.
- How much can the proposed action actually avoid? Separate material or purchased-service savings from capacity released, and account for the action’s own cost.
- What caused the failure? Examine the failed requirement with operators, quality staff and relevant specialists. A high cost identifies where to investigate; it does not prove a tool, supplier or person caused it.
- Who will act, and how will you check the result? Assign an owner, implement the correction and review comparable production under the same acceptance and costing rules.
Keep first pass yield, scrap rate and OEE as diagnostic companions. FPY shows first-attempt acceptance, scrap rate shows permanently rejected output, and OEE separates equipment losses. COPQ puts a monetary value on the failure consequences; multiplying one of those percentages by total sales or manufacturing cost is not a substitute for tracing the costs.
Keep quality-generated work visible in SkyPlanner
The cost review explains what happened. Production also needs a plan for the work the failure created. When rework stays in an unofficial urgent queue, its resource demand is hidden from the orders already scheduled. The supervisor then has to discover and repair the delivery conflicts by hand.
SkyPlanner brings production actuals and finite scheduling into the same working environment. Operators can record faulty quantities when finalizing job time logs. With material tracking configured, material consumption also accounts for faulty units, helping prevent the next job from relying on stock already consumed by failed production.
Time logs record actual work against production jobs, while planned-versus-realized reporting helps you investigate the difference from expected durations. Identify corrective work clearly in the associated jobs and records, so its effort can be traced rather than disappearing into the original order’s total time. Combine that evidence with finance’s agreed rates and the relevant quality and customer records for your COPQ calculation.
Then bring the approved additional operations into the shared production plan with realistic durations, eligible resources, dependencies and priorities. Arcturus, SkyPlanner’s scheduling AI, calculates their placement against configured capacity. The Gantt timeline shows the resulting work sequence and completion dates.
For the imagined rework, the forward question is specific: where can the approved corrective operations fit on the shared machine, and what happens to the orders already using it? Reviewing that connected plan exposes the trade-off before another delivery promise is made. You steer priorities and protected decisions; Arcturus handles the scheduling calculation instead of leaving you to rebuild each affected resource queue.
Choose SkyPlanner when quality-generated work repeatedly becomes a production-planning surprise. You get a clearer view of consumed material and recorded work, less hidden recovery load and a more dependable basis for coordinating the remaining orders. SkyPlanner integrates with any ERP or MES through its open REST API, so existing order and quality records can remain part of that workflow.
Bring one quality failure to a SkyPlanner demo
Choose a recent incident with identifiable material loss, recorded work and approved recovery operations. Bring those details together with an affected customer order to a SkyPlanner demo. Use that situation to explore how the extra work can enter a shared schedule and how its delivery consequences become visible.
Book a SkyPlanner demo to discuss your production, or try SkyPlanner with demo data first. Start with one loss you can explain, one action you can own and a production plan that includes the work still to do.
Jussi Mäntylä
Production Planning Specialist, SkyPlanner


