If you wish to see the Workstation capacity graph in the Gantt Timeline:
- Go to Production Scheduling.
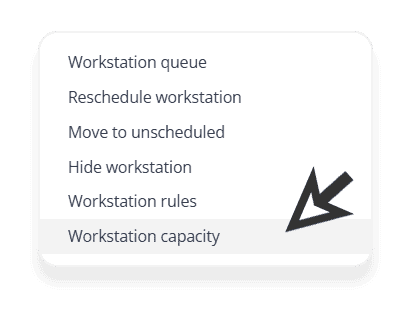
- Right click on the workstation you want to see the capacity graph.
- A dropdown menu will appear, select Workstation capacity.
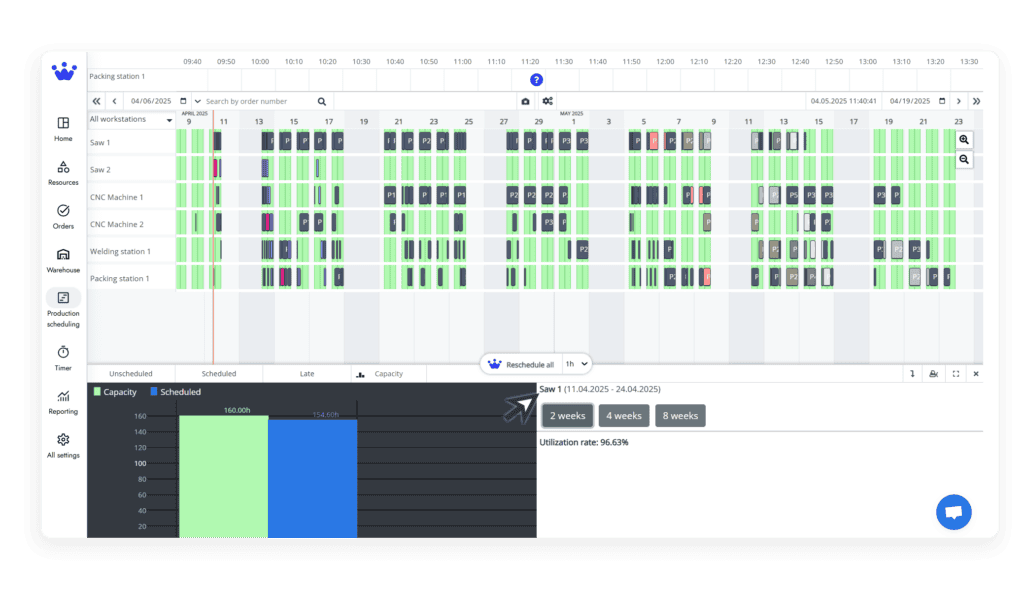
Now, at the bottom, you will see the capacity graph for this workstation.
You can see the capacity for up to 8 weeks.
Learn how to add a Workstation capacity graph in the GANTT Timeline.